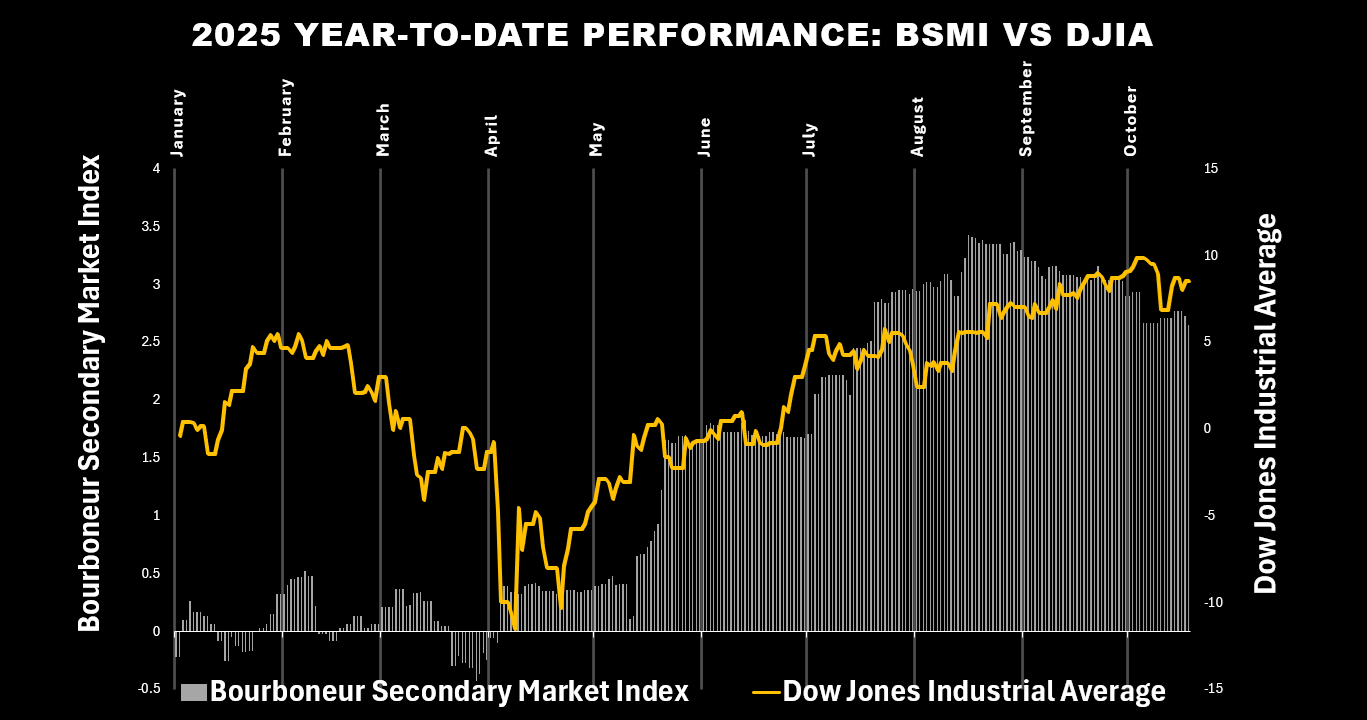
As of mid-October, the Bourboneur Secondary Market Index (BSMI)—our proprietary benchmark for tracking the value of collectible bourbon—has posted a +3.4% year-to-date gain, compared to the Dow Jones Industrial Average’s +8.6% over the same period. While the stock market has roared back after a sluggish start to 2025, the bourbon market has taken a steadier, more tempered climb. Yet when you zoom out and overlay the two indices, the correlation is remarkably tight—illustrating how bourbon’s collectible market continues to mirror broader economic sentiment.
The comparison may surprise some. Bourbon is not a publicly traded asset class, nor does it follow quarterly earnings, interest rates, or GDP reports. But it is increasingly behaving like one—especially when viewed through the data lens of the BSMI.
Launched in 2024, the BSMI is designed to bring transparency, structure, and analytics to the bourbon secondary market. Drawing from verified transaction data, community inputs, and curated price tracking across some of the most heavily traded bottles on the market, the BSMI functions as the bourbon world’s Dow Jones—a composite measure reflecting the aggregate performance of collectible bottles over time.
Every day, the index updates within the Bourboneur app, allowing users to:
• Track real-time value changes in their own collections
• Benchmark portfolio performance against the broader market
• Compare movement against major economic indicators like the DJIA
In other words: while traditional investors refresh their stock apps, bourbon enthusiasts now have their own market feed—one powered by the Bourbon Blue Book® and backed by verifiable, crowdsourced data.
The year began quietly for bourbon collectors. January through March saw modest gains before the market softened in April and May, echoing consumer pullbacks and broader retail spending dips. The spring slump was driven primarily by pricing corrections on mid-tier allocated bottles from Buffalo Trace—think Blanton’s Gold, Weller 12, and E.H. Taylor Single Barrel—where secondary prices normalized after two years of speculative highs.
By mid-summer, however, the market began to regain momentum. Secondary trades picked up again in July and August, led by premium and ultra-rare releases such as the Parker’s Heritage Double Barrel Blend and Russell’s Reserve 15. As these bottles got hot, collector activity spiked and confidence followed.
Meanwhile, Wall Street’s rally—fueled by tech resilience and steady interest rate expectations—offered a striking parallel. The BSMI’s shape closely followed the DJIA’s, showing how even in a niche asset market like bourbon, macroeconomic optimism can translate into collector confidence and liquidity.
Despite their correlation, bourbon and equities operate under very different fundamentals. Stocks react to earnings reports, monetary policy, and investor sentiment; bourbon reacts to scarcity, reputation, and emotion. Yet both respond to confidence—and confidence, as this year has proven, is contagious.
When the economy strengthens and disposable income expands, luxury collectibles benefit. Bourbon’s resurgence in the second half of 2025 aligns with a rebound in discretionary spending and renewed enthusiasm among both buyers and traders.
Still, bourbon’s performance profile remains more stable than stocks. The BSMI’s lower volatility underscores bourbon’s strength as a niche asset: while not immune to dips, it rarely experiences sharp selloffs. In fact, during the brief April drawdown, the BSMI never fell below 0%, even as retail pricing softened.
This section highlights year-to-date trends for some of the bottles that have helped shaped the 2025 market:
• Blanton’s Gold: Steady ongoing erosion of secondary market price throughout 2025.

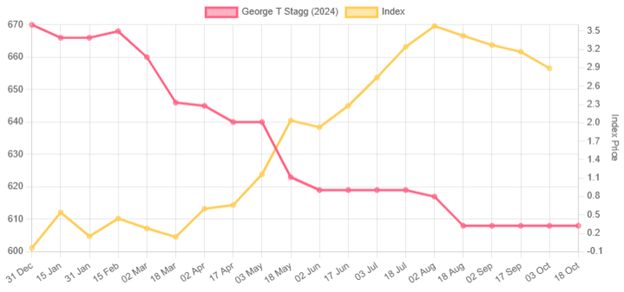
• George T. Stagg (2024): High variance early in the year coming off the 2024 release hype, stabilizing post-summer.
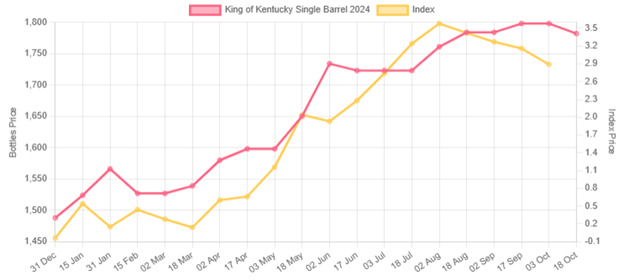
• King of Kentucky (2024): Strong upward momentum tied to scarcity.
• Parker’s Heritage Double Barreled Blend (2022): Consistent appreciation and record trade volumes.

• Old Rip Van Winkle: Fall flurry, run up on Old Rip likely tied to higher attention on fall release of the Pappy lineup.
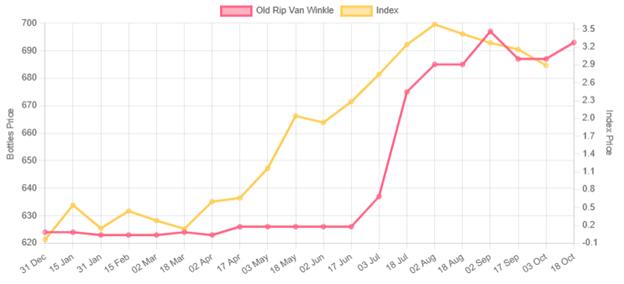
Each of these bottles tells its own story—one of scarcity, oversupply, or hype—but together, they form a piece of the mosaic that drives the BSMI’s overall trajectory.
While the BSMI offers a macro snapshot of the secondary bourbon market, the Bourboneur app allows users to see how their own collections perform against it.
Every bottle tracked in the Bourbon Blue Book® has its own data signature: verified pricing history, volatility score, and current average value. When users log bottles into their digital collection, the app automatically updates those values based on the latest verified trades—giving each collector a live portfolio that fluctuates as the market moves.
This integration between the BSMI and individual portfolio analytics means every collector can measure their performance in real time. You can see:
• How your collection has appreciated over time
• How your collection has fared year to date
• Where the BSMI stands for the day
The result is a dynamic, data-driven view of bourbon collecting that blends the passion of whiskey hunting with the discipline of portfolio management.
Bourbon’s evolution from drink to investment has been underway for nearly a decade, but 2025 underscores just how mature the secondary market has become. Liquidity, price discovery, and valuation tools—once scattered across private groups and anecdotal exchanges—are now unified under digital platforms like Bourboneur.
While no one should view bourbon as a replacement for equities or bonds, it increasingly behaves like a complementary asset class—a tangible, culture-driven store of value that responds to scarcity, sentiment, and storytelling.
In periods of inflation or uncertainty, bourbon’s limited supply and passionate demand have historically made it resilient. When markets rise, collector enthusiasm compounds that effect. The result: a market that may be small in scale, but large in signal.
At +3.4% YTD, the Bourboneur Secondary Market Index shows that the bourbon market continues to climb at a measured, sustainable pace—less volatile than equities but no less tied to broader economic energy. Its tight correlation to the Dow Jones Industrial Average highlights how bourbon collecting has transcended hobbyism, evolving into a legitimate parallel market driven by data, scarcity, and culture.
As 2025 enters its final quarter, all eyes are on the fall release season—when the Buffalo Trace Antique Collection, Old Forester Birthday Bourbon, and Four Roses LE releases traditionally move the market. Early trade volumes suggest an active finish to the year, and we’ll continue to track it every step of the way.
The bourbon market isn’t just about what’s in the glass—it’s about understanding the story behind every bottle and the movement it represents. As of today, the Bourboneur Secondary Market Index (BSMI) is up +3.4% YTD, tracking closely alongside the Dow. Numbers like these matter—whether you’re buying, selling, or just keeping score.
Drop season is here—and with it comes chaos. Bottles hit shelves, secondary prices spike (or dip), and more than a few wallets get burned. To navigate the madness, you need more than hype. You need real data.
That’s exactly what the Bourbon Blue Book® delivers: over 8,000 bottles tracked, live market values, and constant updates—all inside the Bourboneur app. No noise. No guesswork. Just clarity.
👉 For $3/month or $25/year, the Blue Book pays for itself the moment you avoid one bad buy—or spot the right deal.
And bourbon isn’t just about bottles - it’s community—join 26,000+ ethusiasts who live this passion every week. From bottle drops and market insights to reviews and flavor debates, you’ll be first in line for what’s happening next.
📲 Download the app on iOS or Android.
📩 Subscribe below for our weekly insider email.
📷 Follow along on Instagram, Facebook, and TikTok.
That’s Bourboneur.
.png)

.png)

.png)
0 Comments